Hi @Govind_Kalburgi,
Welcome to our Forum Friday event! And thanks for posting it so others could consume.
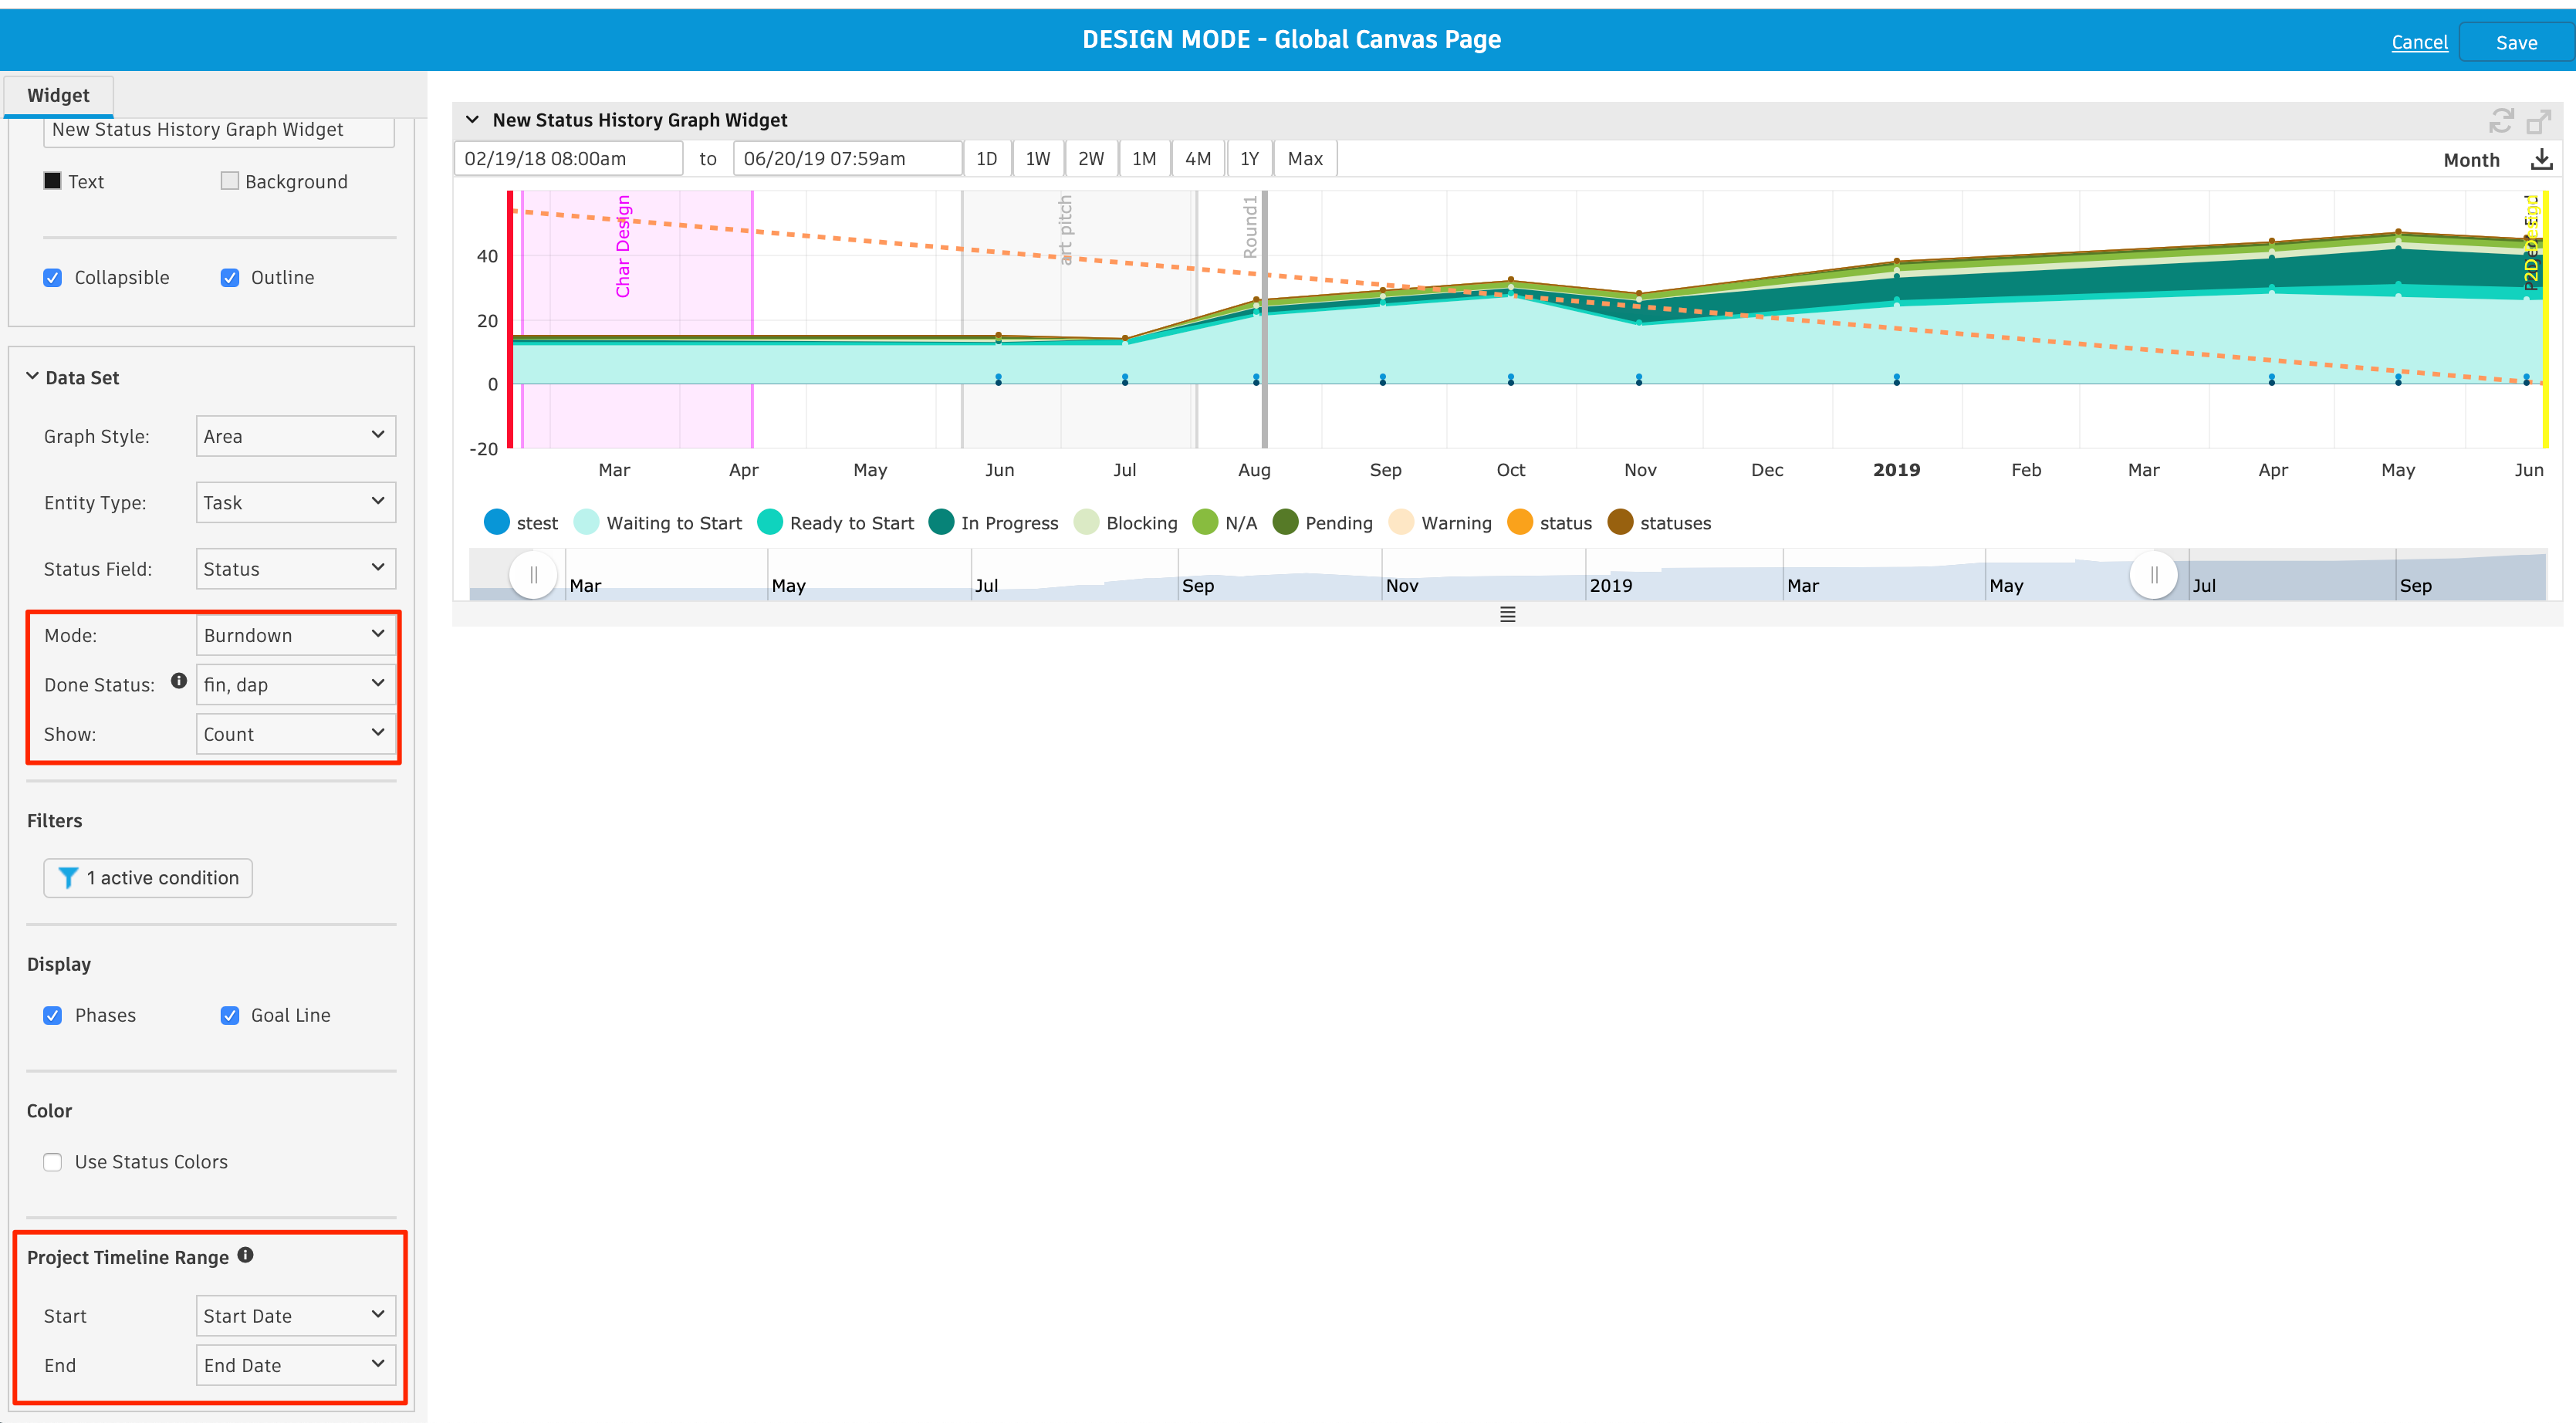
To set a Goal line, you need to go to Configure page of the “Status History Graph”, and set it as below:
- “Burndown” for “Mode”
- “Final” for “Done Status” (to exclude the “fin” status from your graph)
- “Count” for “Show”
And then to draw the dotted “Goal Line” to see your target goal, you need to set the Start and End of your Project Timeline Range. This line is drawn using the total amount from the start date of your range to a target of “0” on the end date.
I’m testing it on a Global canvas page, so don’t think it’s a problem at all. Let me know if you still don’t get the it.
Cheers,
Ben