Why I can’t make a simple graph to see visually a bid vs time log by task for a project?. It don’t seems difficult, but I can’t make one! any help?
Thanks!
Why I can’t make a simple graph to see visually a bid vs time log by task for a project?. It don’t seems difficult, but I can’t make one! any help?
Thanks!
Do you have an example of what you are trying to do?
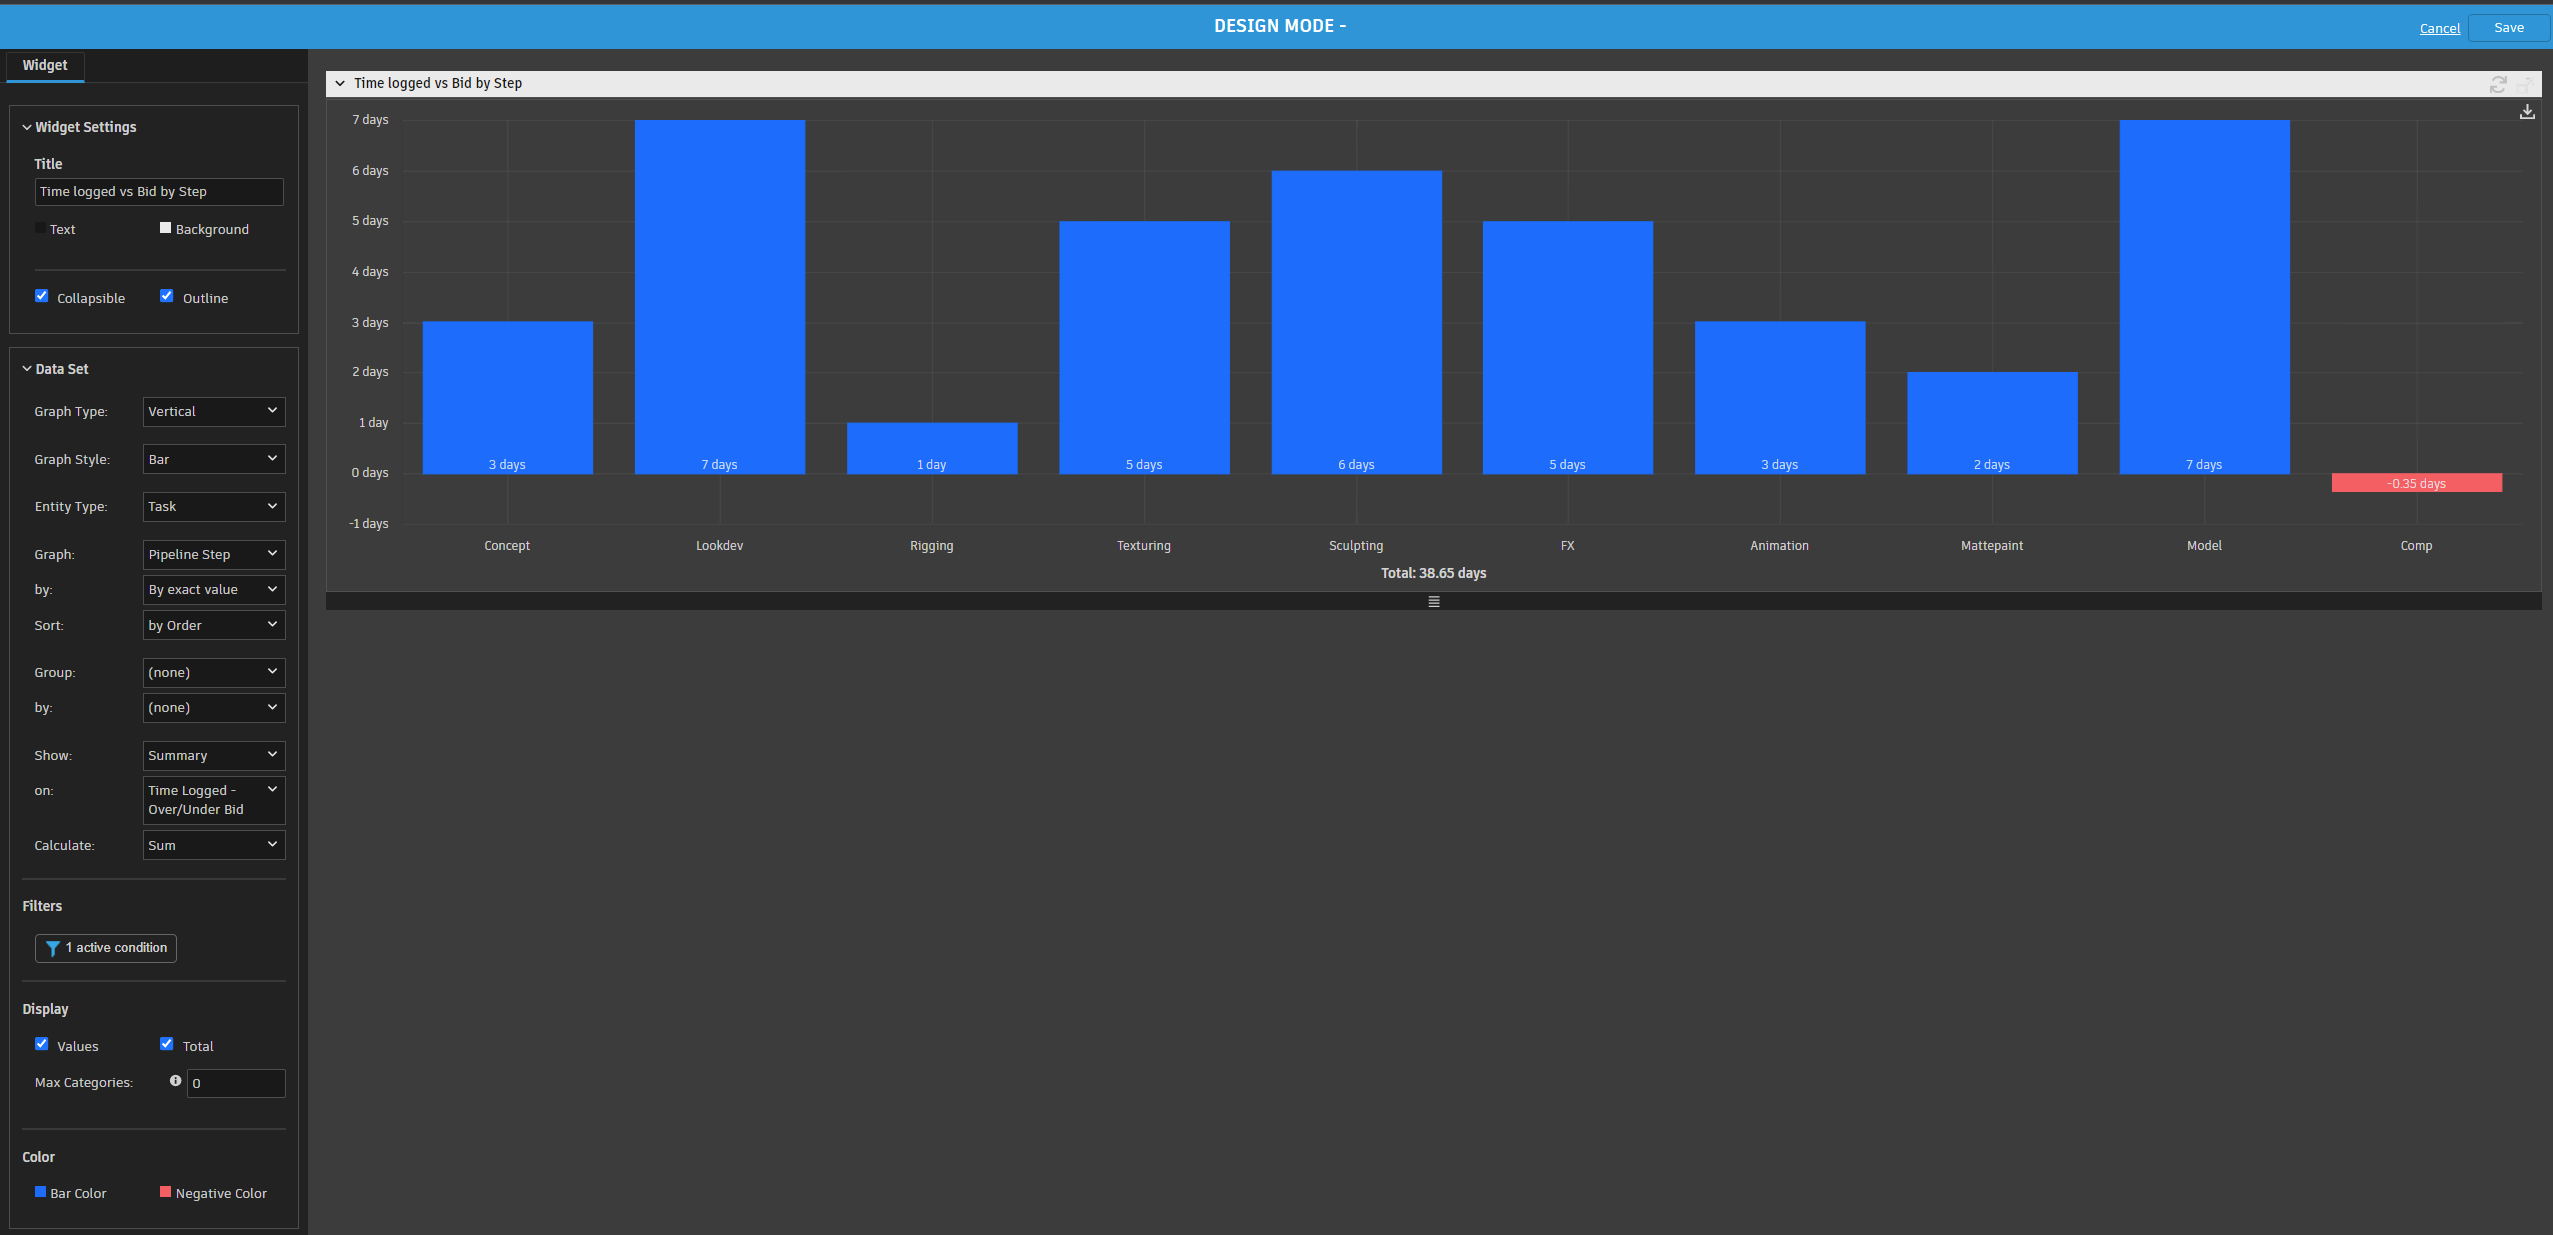
Hi Ricardo. Yes, the only thing I want is a graphic representation of this data. Task, number of tasks, and the summaries of the time logged and bid for that range of tasks… I think is an easy thing to do, but I can’t find any solution with the graph widget. Thanks!

Hi Jonas, thanks for all. This solutions helps, it’s another way to see differently the same data… It’s not what I looking for, but it helps a lot. Thank you very much.
For me, It’s much easier if I can have 2 columns, one with the summarize of the bid, and another with the summarize of the time logged. My objective is to avoid that the time logged column surpass the bid column. With your solution the objective is to avoid going below 0…
thanks for all. I’m still looking for my custom solution, but, as I said, this helps a lot.
Thank you very much.
Maybe stacking two separate widgets on top of each other could work? Maybe not exactly what you are looking for either but that would be another workaround.
Hey Chema, Looks like we are both looking for exactly the same thing. Did you ever find your answer?