My gut is telling me that this may need to be done outside of ShotGrid, but I was wondering if anyone had any solutions when it comes to visualizing data over time in ShotGrid.
The things I’m looking at are things like, how much is an artist completing on average per week. The closest I’m kind of seeing is graphing by status change, but that’s not quite what we’re looking for, and it’s not really providing a method of capturing average productivity as a value we can identify.
Is this something ShotGrid can do out of the box with a clever query field, or something? Is there a scripting solution that’s required? Or is it better to export our data into a separate tool?
Just off the top of my head (so there very well may be a better solution) you could add an event trigger to set a hidden “Date Completed” field on the task to todays date when you flip the task to Completed.
Then graph the dates by Person, should work.
@MatteoVeglia Thank you for this idea; this covers a lot of ground, especially since I already have a field that’s tracking that exact thing.
I’m thinking what might also help is to have a second column that tracks the week ending date, to simplify the data into work periods, instead of single days.
I’m not sure it can be done, but at that point, I might be able to try and figure out another field that lets me generate an average in some way… maybe with the workload, or another kind of calculated field… I’ll have to ponder this some more… And thanks again!!
If anyone has any other suggestions, would still be glad to hear alternatives!
What is your unit for tracking the work? Is it frames, seconds or task count? The current widgets do support various operations like sum, max, min and average.
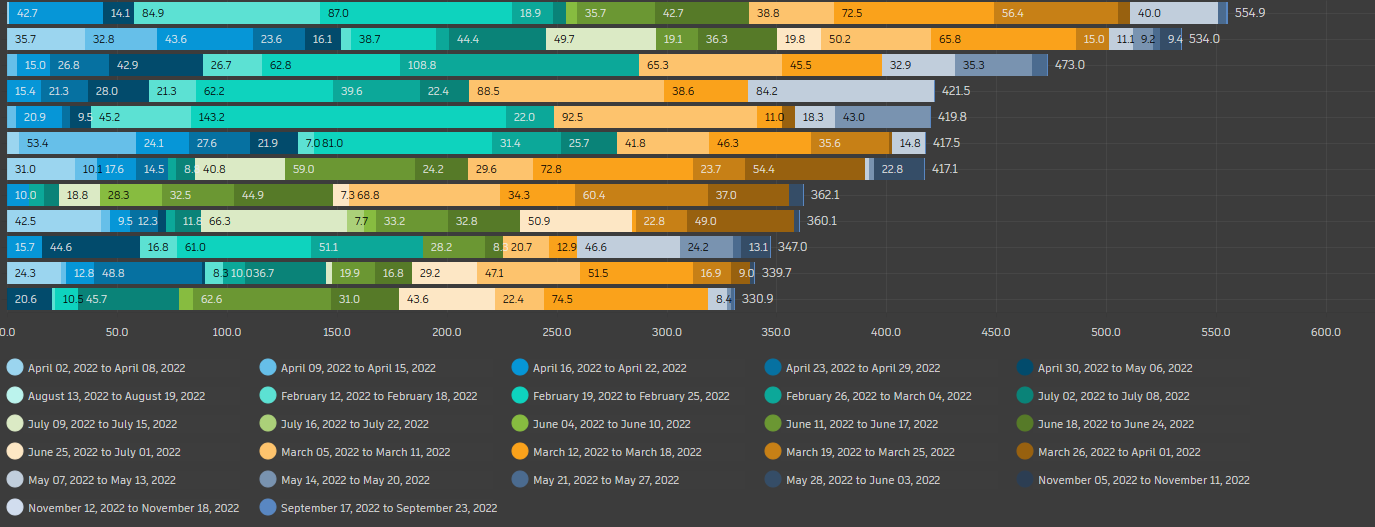
You should be able to group your date field by weeks to see weekly numbers and then choose the average operation to show you average numbers for that week. The graph would looks something like this
The unit will vary between departments, but I imagine a working template could be applied to any of those units, so long as the necessary info exists.
Thank you for for showing me that I can group all of this by week; that actually eliminates a need for a “work period column”; That’s extremely helpful!
Unfortunately, it’s taken me only tantalizingly closer.
I can use an average summary, but it tries to summarize the average number of frames per completed scene in that week first
for example, these folks actually completed around 400 frames each week, but since each scene was 50-80 frames long, the averaging function actually crunches all my numbers before I want them crunched.
I’d be looking more to get these summary numbers at the end to indicate how many frames per week they managed. (i.e. the centre two rows would be averaging about 369 frames per week.)
If you’ve any thoughts here, I’d love to hear them, but that tip about grouping per week is already golden
Ya AFAIK that last number shown is always the sum and the arithmetic operation(Min, max, avg, sum) is always applied on the grouped data. So you would be able to see the average per week within that grouped data but not an average of all those weeks combined.
You might have to make a separate graph just to see that without the grouping
If you keep the filters the same then this average would be for the same time period as the other widget.
I think I’m going to have to continue some experimenting; it’s getting closer, and this is a good reminder that groupings can have some impacts on how the summaries work.
I’m thinking that what I’m envisioning isn’t quite possible, so I’ll flag your response as the answer, but I’ll try and follow up on this line for posterity if I come across anything else interesting.